The Department of Civil and Environmental Engineering
The Hong Kong University of Science and Technology
Mapping residents’ perception of safety through street view images and interpretable AI: a Hong Kong case study
*This project is funded by Public Policy Research Funding Scheme under Chief Executive's Policy Unit
Research Objective:
Creating a city that feels perceptually safe is just as important as maintaining a well-policed environment. Although Hong Kong, as a leading international metropolis, boasts one of the lowest crime rates in the world, numerous studies have shown that its built environment often fails to instill a strong sense of safety among residents. Fostering a sense of safety is not only crucial for daily life and mental well-being, but also enhances the city’s attractiveness, vibrancy, and economic development. Therefore, it is essential to shape an urban environment that aligns with the city’s low crime rate. However, there remains a lack of effective methods for assessing perceived safety at the scale of large urban regions. Recent advances in geographic artificial intelligence (GeoAI) and the proliferation of urban big data offer unprecedented opportunities to understand and measure the perception of place. To address this gap, we will (i) design and train a GeoAI model to evaluate human visual perception of safety using Google Street View images and satellite imagery; (ii) establish a comprehensive dataset on residents’ safety perceptions in the physical environment and produce a safety perception map of Hong Kong to inform the work of various government departments; and (iii) explore the factors influencing safety perceptions and “perception bias” through interpretable AI, providing policy support for initiatives such as the Lantau Tomorrow Vision and the Northern Metropolis, based on the safety perception map of Hong Kong.
1. The GeoAI Model to Evaluate Human Visual Perception of Safety
In this project, we have designed an artificial intelligence (AI)-based data fusion framework aimed at generating novel safety perception assessments by integrating visual and textual features for the whole Hong Kong. This framework comprises three key stages:
-
Stage One: Generation of Contextualized Image Descriptions. In the first stage, we combine the visual features provided by Street View Images (SVIs) with textual features generated by large language models (LLMs) to create detailed contextualized descriptions for each image. Specifically, we input the SVIs directly into the LLM to produce general descriptions of the urban environment. Subsequently, we incorporate profile information such as individuals' age and gender, as well as specific scenarios (e.g., crime or traffic accidents) as additional inputs to the LLM.
-
Stage Two: Training a General Deep Learning Model. In the second stage, we utilize the general image descriptions generated in the first stage as a baseline and combine them with ground truth safety perception data from existing datasets to train a deep learning model. During this process, we employ a supervised learning methodology, wherein the model learns to predict corresponding safety perception scores based on the input images and their descriptions.
-
Stage Three: Contextual Fine-Tuning and Pseudo-Label Iteration. In the third stage, we introduce safety perception descriptions tailored to specific population groups and contexts to fine-tune the previously trained model. To achieve the effective domain shift from general safety perceptions to specific safety perceptions with the absence of ground truth, we adopted a pseudo-labeling training paradigm.
Figure 1: diagram of the steps used in this project
We validated our framework in real-world individual-level safety perception survey data. As shown in the table below, when the baseline model was applied to demographic-specific data, its performance metrics experienced a significant decline, dropping from 0.76 to around 0.6, representing a decrease from 19.7 to 25 percent. The finetuned model demonstrated a notable improvement, with performance increasing by 14.9 to 24 percent compared to the original model. This experiment proves that general models are insufficient in representing safety perception with specific demographic characteristics, while our proposed method is effective in capturing the differences in safety perception among different demographic characteristics.
The results highlight the importance of evaluating different population groups’ safety perception for different scenario, even though it will take a long period and cost to collect necessary data through survey. Our framework can effectively fit different population group’s perception through advanced AI even without the real-world survey data.
2. A Safety Perception Map of Hong Kong
We applied the proposed method to the Hong Kong region, constructing safety perception evaluation models for crime and traffic accidents targeting elderly, middle-aged, males, and females. Based on these models, we assessed safety perceptions across different demographic characteristics and scenarios. Figure 2 presents the kernel density estimation results for various demographic features and perception scenarios.
Figure 2. Safety perception distributions in the Hong Kong region (a) Safety perception on traffic accidents of citizens of different ages. (b) Safety perception on traffic accidents of citizens of different genders (c) Safety perception on crime activity of citizens of different genders (d) Safety perception on crime activity of citizens in different ages.
As shown in Figures 2a and 2b, the overall performance of traffic accident safety perception in Hong Kong is relatively positive. Benefiting from an efficient traffic control system and a robust legal framework, residents generally exhibit a high level of safety awareness towards traffic accidents, with an average score of approximately 8 out of 10. However, significant differences exist between genders and age groups. Specifically, females generally have lower safety perceptions regarding traffic accidents, and elder residents also show lower safety perceptions compared to middle-aged residents. Figures 2c and 2d illustrate the safety perceptions of different groups in Hong Kong towards crime. Figure2 c reveals that the elders have higher safety perceptions, concentrated around 8 points, while middle-aged citizens exhibit a polarized distribution, with some concentrated around 6 points and others reaching higher levels. This may reflect a stronger fear of criminal behavior among young females. Additionally, males have higher safety perception scores, concentrated around 8, whereas females' scores are centered around 5.5, indicating a lower sense of security when facing potential criminal threats.
Figure. 3 Safety perception maps across Hong Kong. (a) Traffic accident safety perceptions for middle-aged citizens. (b) Traffic accident safety perceptions for elder citizens. (c) Traffic accident safety perceptions for males. (d) Traffic accident safety perceptions for females. (e) Crime activity safety perceptions for middle-aged citizens. (f) Crime activity safety perceptions for elder citizens. (g) Crime activity safety perceptions for males. (h) Crime activity safety perceptions for females.
From the data depicted in Figure 3, it is evident that regions with higher safety perceptions concerning traffic accidents are predominantly located in northern Hong Kong (such as the northern New Territories) and eastern Hong Kong Island (such as the Eastern District). These areas benefit from more efficient traffic management systems and superior infrastructure, resulting in residents experiencing a generally higher sense of safety.
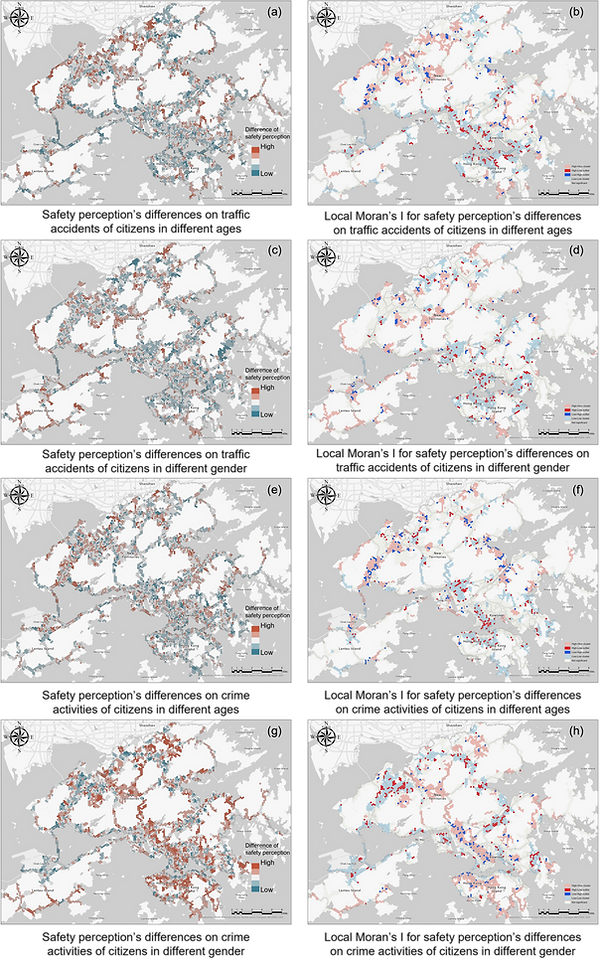
Figure 4 Safety perception differences in Hong Kong based on age, gender, and scenarios (traffic accidents and crime). (a) Age-based differences in traffic accident safety perceptions. (b) Local Moran’s I for age-based traffic accident safety perception differences. (c) Gender-based differences in traffic accident safety perceptions. (d) Local Moran’s I for gender-based traffic accident safety perception differences. (e) Age-based differences in crime activity safety perceptions. (f) Local Moran’s I for age-based crime activity safety perception differences. (g) Gender-based differences in crime activity safety perceptions. (h) Local Moran’s I for gender-based crime activity safety perception differences.
In examining the differentiated safety perceptions among various age groups, it was observed that in southern Hong Kong Island, elderly residents exhibit significantly higher safety perceptions compared to their middle-aged counterparts. This may be attributed to the relatively quiet residential environments and lower traffic volumes in these areas. Conversely, in most other parts of Hong Kong Island and Kowloon, the differences in safety perception across age groups are minimal, indicating a broadly stable traffic condition. Notably, in northern Hong Kong, younger residents report higher safety perceptions than elderly residents, potentially reflecting a greater trust in modern traffic facilities and technologies among the younger population.
Regarding gender differences, the overall trend indicates that males possess higher safety perceptions related to traffic accidents than females, particularly within Kowloon and Hong Kong Island. However, an exception is observed in the Sai Kung area, where females report higher safety perceptions than males. This discrepancy may be due to Sai Kung's superior natural environment and reduced traffic pressure, which may attract more females who prioritize quality of life. Similarly, in northern Hong Kong, females demonstrate higher safety perceptions than males, suggesting that specific environmental factors in this region differentially impact genders.
By analyzing the differences in safety perceptions between younger and older adults, we found that age-related disparities are minimal in bustling commercial districts like Hong Kong Island and Kowloon, where younger populations dominate. In contrast, areas with traditional industrial and rural characteristics, such as Tuen Mun, Yuen Long, Sheung Shui, and Fanling, exhibit significant age-related differences due to a higher proportion of elderly residents and insufficient age-friendly community facilities. Local Moran's I index analysis further confirms this spatial distribution pattern: low-difference clusters in Kowloon and Hong Kong Island, and high-difference clusters in Tuen Mun-Yuen Long and Sheung Shui-Fanling. Notably, outlier areas like Causeway Bay and Kowloon Tong, despite being in low-difference clusters, show unusually high disparities, highlighting intergenerational safety conflicts caused by high population mobility and a lack of inclusive public space design. Regarding gender differences in traffic safety perceptions, regions like Kowloon, Hong Kong Island, Cheung Sha Wan, and Sai Kung exhibit smaller disparities, while parts of the New Territories and Lantau Island show more pronounced differences, primarily due to systemic deficiencies in nighttime safety infrastructure (e.g., smart lighting, emergency call systems) and safety design at public transport hubs. These findings reveal the spatial patterns of multi-dimensional safety perception disparities, providing a scientific basis for developing targeted urban renewal strategies that promote intergenerational inclusivity and gender equity.
3. Factors that Influence the Safety Perception
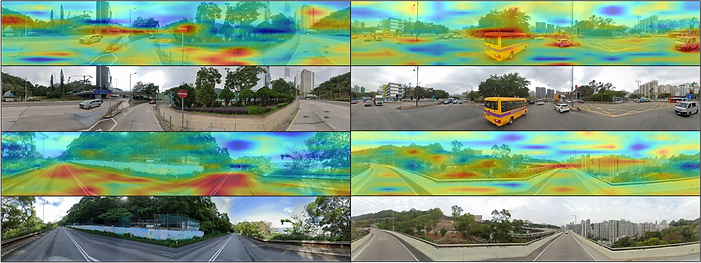
We adopt Grad-CAM to reveal the crucial urban landscape that drives the safety perception, as shown in Figure 5 below:
Figure 5: the evaluation results of Grad-CAM across different built environments
The upper half of each image displays the Grad-CAM outcomes, which illustrate the regions of the image that the deep learning model focuses on during the safety perception assessment process. Red areas indicate regions with a high contribution to safety perception, while blue areas signify regions with a lower contribution. In areas with higher safety perception scores, the model successfully identifies a range of features that contribute to an enhanced sense of safety. For instance, clearly visible traffic signs, distinct road markings, and informative signage are prominent traffic management features that significantly improve road safety. Additionally, the presence of tall buildings in the distance not only provides a contextual background but also implies a well-developed and well-maintained built environment, further reinforcing the overall sense of safety. These elements enable pedestrians and drivers to navigate urban spaces with greater confidence. Conversely, in areas with lower safety perception scores, the model tends to focus more on factors that may induce unease. A higher density of nearby vehicles is prominently highlighted, suggesting that heavy traffic increases the potential risk of collisions, thereby diminishing the sense of safety. Additionally, low-lying shrubs and other vegetation are identified as areas of concern, as they may obstruct visibility or conceal hazards, thereby impacting the judgment of road users. It is noteworthy that in regions with higher safety perception scores, trees are present but have minimal impact on the model’s scoring. This is likely because these trees are typically located in areas that do not interfere with traffic and are adequately trimmed, ensuring they do not obstruct sightlines or pose safety risks.
Figure 6. Specific response results of different POI types to safety perception differences
Regarding traffic safety perception, POI variables associated with commercial activities exhibit a notable positive influence on safety perception differences. For example, areas with high concentrations of commercial activities, such as Lifestyle Services and Leisure and Entertainment facilities, can amplify individuals' concerns about traffic safety. These regions typically experience high pedestrian and vehicular traffic, which may increase the risk of traffic accidents, thereby diminishing residents' sense of safety. Conversely, locations closely linked to daily life and work, including Financial Institutions, Commercial and Residential Areas, and Science Education and Culture institutions, exert a negative influence on traffic safety perception differences. These sites generally benefit from superior management and planning, providing a more orderly and secure environment that enhances individuals' sense of safety.
When examining gender differences in safety perception within the context of crime, certain POI types demonstrate significant negative correlations. Specifically, the presence of areas such as Dining and Cuisine, Medical and Healthcare, and Transportation Facilities appears to alleviate safety concerns among females. These locations typically feature adequate lighting conditions, surveillance systems, and other security measures, offering women a more secure travel experience. Additionally, these sites are often hubs of frequent public activities with substantial pedestrian traffic, which reduces the likelihood of potential criminal activities, thereby making women feel safer in these environments.
In summary, different POI types not only shape the physical landscape of the city but also profoundly impact residents' safety perceptions. By understanding these associations, urban planners and policymakers can more effectively optimize the spatial layout of urban areas to enhance the safety perceptions of all citizens. For instance, strengthening traffic management in commercially active zones and implementing increased security measures in sensitive areas can ensure that all parts of the city are comfortable and secure environments for residents. This data-driven urban planning strategy not only improves the existing environment but also provides essential guiding principles for future development.